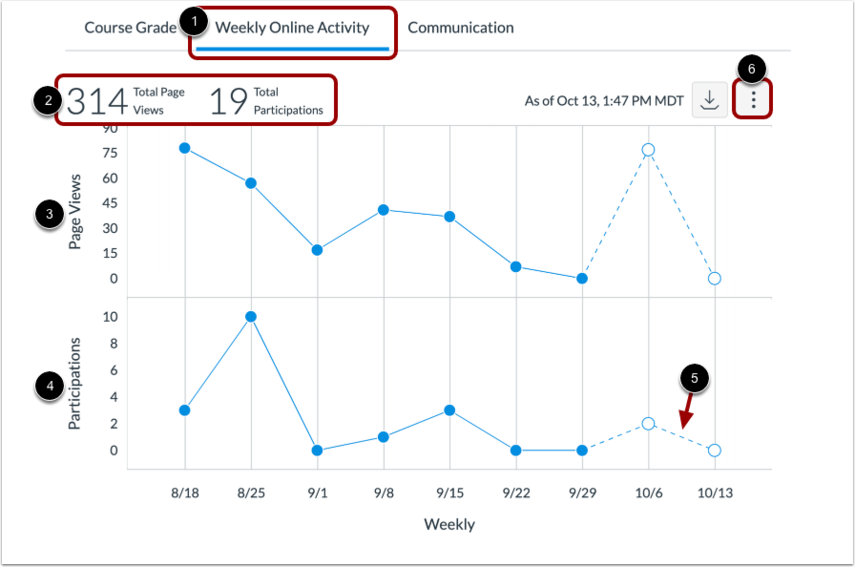
The New Analytics tool is enabled in courses by default. This tool allows instructors to view student participation, grade distribution and comparison across course, section, or student for a weekly aggregate period, and download that data as a CSV file. Instructors can also communicate with students as needed directly from a chart or data table.
New Analytics Calculation
The data used for the New Analytics is refreshed every 24 hours. This means that any changed to students’ participation within last 24 hours would not be reflected in the data.
- Only active student enrollments are included in data for New Analytics.
- The default view will display a grade distribution chart. The average course grade is the average of all student totals from the Gradebook. Course analytics will show you student activity, assignment submissions, grades, and student names.
- Page views and participation metrics include an aggregate across all devices, including Canvas mobile apps.
- New Analytics performance is measured using a course weight, which is the number of students in a course multiplied by the number of assignments (including quizzes and any other graded work). If your course has 1000 students and 50 assignments, your course weight is 50,000. The majority of Canvas courses carry a course weight of less than 50,000. Any courses with a higher course weight are not currently supported.
Using the New Analytics Tool
Click the New Analytics button found to the right on your course Home page. The course navigation will also include the New Analytics tool link. This link will ONLY be visible to instructors, admins, and TA’s.
The default view will display the dynamically generated data chart. The chart will display the weekly aggregate participation of all active students in your course.
In addition to student participation, you can see the count of page views and student participation for specific resources in the course. Click the Resources tab that appears below the data chart or table.
On the Resources tab, you can view the resource name, the number of students who accessed the page, the number of views for the page, and the number of participations for the resource.
You can also view course grade and participation analytics for an individual student.
Grade View
The new analytics tool allows you to;
- View average course grade analytics as an interactive chart graph or a data table
- Compare the course average with an individual assignment, course section, or student filter using the chart graph comparison or data table comparison
Participation
New Analytics allows you to:
- View average weekly online participation analytics as an interactive chart graph or a data table.
- Compare the course average weekly online participation analytics with an individual student or section using the chart graph comparison or data table comparison
Communicating with Students
You can
- Send a message to all students based on specific course grade or participation criteria
- Send a message to an individual student based on specific course grade or participation criteria
Any sent messages can be viewed in the Sent folder in the conversations Inbox. Messages sent to more than one student are sent as individual messages.
Downloading Data
You can export the data that appears in the table or chart. If the data displayed is filtered by assignment type or specific course section, for example, only the displayed data will be included in the downloaded file.
The downloaded CSV files include the following data: student’s name, Canvas user ID, Cornell email and student ID, overall course grade, the percent that assignments have been on time, the last page view time, the last participation time, and the last time the student logged out.
Reports
New Analytics has multiple reports that can be downloaded as a CSV file. These reports include:
- Missing Assignments: a list of assignments that have not been submitted yet
- Late Assignments: a list of assignments that have been submitted late
- Excused Assignments: a list of assignments that are excused
- Class Roster: a list of students enrolled in the course or section with student contact information such as email
- Course Activity: a list of daily user views and participations


